
Signet Industries Share Price Surges 19.99%: A Perfect Storm of Fundamentals and Technicals
The Big Jump: Why Signet Industries Stock is Turning Heads
Have you ever seen a brand-new video game or a popular toy sell out in just one single day? People rush to the store, and before you know it, the shelves are completely empty. That kind of wild excitement is exactly what just happened in the stock market to a company called Signet Industries.
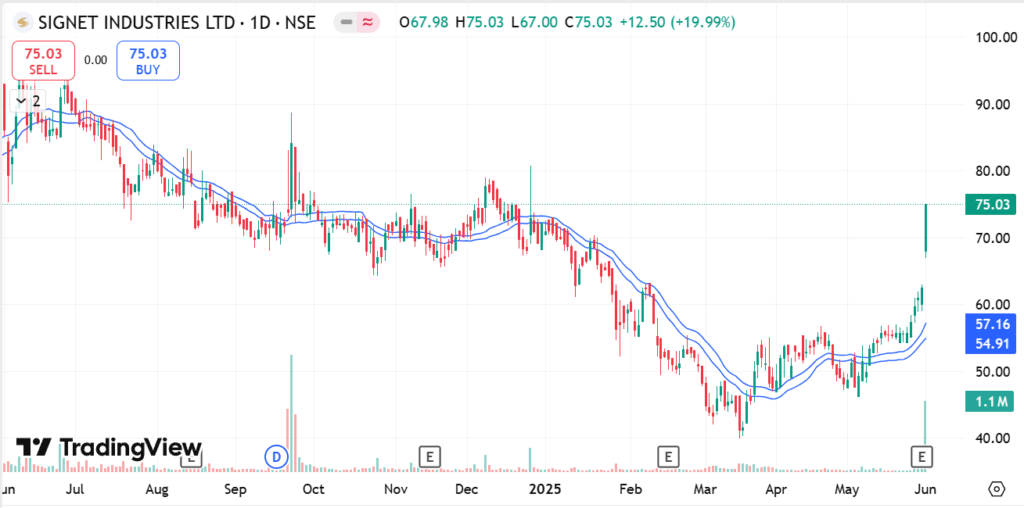
On June 2, 2025, their stock price—which is the cost to buy one tiny piece of the company—did something really amazing. It jumped up by almost 20% in a single day! It reached a price of ₹75.03. In the stock market, when a price goes up that fast, the computers actually put a “lock” on it so it can’t go any higher that day. That is exactly what happened here. And it wasn’t just a few people buying. A massive 1.2 million shares were traded back and forth. That is over three times more than normal!
But why did this happen? It wasn’t just a lucky break or a silly rumor. It happened because the company is doing really well, and the math shows it was a great time to buy. Let’s look closer at why this happened and what might come next.
Part 1: The Exciting Trading Day
The day started with a huge bang. Right at 9:00 in the morning, the stock opened up at ₹75.03. That was already way higher than the price from the Friday before, which was only ₹62.53. Throughout the day, the price bounced around a little bit between ₹67 and ₹75.03. This bouncy movement showed that a lot of people really wanted to buy it and were willing to pay top dollar. The huge number of trades tells us that big, professional investors—people who buy millions of dollars of stock at once—were probably stepping in to buy.
We also have special math “tools” to measure how hot a stock is. One tool acts like a thermometer. It showed a really high fever, meaning the stock is super hot and moving fast with tons of money rushing in. At the end of the day, buyers wanted so many shares that the computer had to stop the trading. There were nearly 100,000 orders waiting to buy the stock, but nobody was left wanting to sell!
Part 2: The Really Good News
Why were people so excited? First, the company got their “report card” for the end of the year, and they got straight A’s! The total money they brought in from selling things went up by almost 20%. They made ₹122.8 crore. That is their best score in three whole years. Even better, their actual profit—the money they get to put in the bank after paying all their bills—shot up by almost 64%! Because they did so well, they decided to share some of that extra money with the people who own the stock. They gave out a cash bonus, which is always nice.
Second, the stock is still on a big sale. Imagine finding a really nice bicycle for half the price of the other bikes in the store. That is what Signet Industries looks like right now. When we compare it to other similar companies, Signet is much cheaper. People who look for good deals see that Signet is trading for less money than the company’s buildings and tools are actually worth.
Third, the company is getting stronger. They have a great “health score” for their money. And the people who started the company still own almost 73% of it. When the bosses keep that much of their own company, it means they truly believe the company will keep growing.
Part 3: Looking at the Treasure Map
People who study the stock market love to look at charts. Charts are like treasure maps that show where the price has been and where it might go. Recently, the price broke through a hard “ceiling” at ₹72.35. When a stock breaks the ceiling with a lot of people buying, it usually means it will keep going up.
The line on the chart also made a shape that looks exactly like a tea cup with a small handle. In the stock market, this “cup and handle” shape is a very good sign. It usually points to the price going even higher. Also, the short-term average price crossed right over the long-term average price. Experts call this a “Golden Cross.” Just like it sounds, it means golden days might be ahead!
Part 4: Guessing the Future Price
So, where is the price going next?
In the short term (the next 1 to 3 months): The best guess is that it reaches ₹84. This would happen if good news keeps coming. A middle guess is that it stays around ₹77. A bad guess is that it drops down to ₹69.
In the medium term (the next 6 to 12 months): The price could climb to somewhere between ₹91 and ₹97. This would happen because more people will realize the stock is too cheap and start paying a fairer price for it.
Looking way ahead (the next 2 to 3 years): Some experts think it could reach over ₹116! That would be a huge win. As long as the company keeps making good money, a price of ₹100 or more is very possible.
Part 5: The Hidden Dangers
But wait, it’s not all perfect. There are some risks to think about. First, the company owes some money to the bank. Paying the fees on that borrowed money eats up a chunk of their cash. Second, the things they need to build their products might get more expensive. If shipping costs go up, they might make less profit.
Third, remember those “tools” that said the stock was super hot? Well, sometimes when things get too hot, they need to cool down. Because the stock went up so fast, it might drop a little bit for a short rest before it goes up again. Finally, if the whole stock market has a bad day, Signet Industries will probably drop too.
Part 6: How to Play it Safe
If someone wants to buy this stock, they need a plan. A bold plan would be to buy half of what you want right now, and wait to see if the price drops a little bit to buy the rest. A safer plan is to just wait and hope the price drops down to ₹70 before buying.
It is also smart to put a “safety net” in place. If the price drops below ₹66.90, you might want to sell it so you don’t lose too much money. Remember, never put all your money into just one thing!
Conclusion
The huge 20% jump for Signet Industries was super exciting, and it happened for very good reasons. The company is making more money, the stock is a great deal, and the charts look very positive. But, always remember that stocks can go down too. You should always be careful because of the money they owe and the chance that the price went up a little too fast.
(Always do your own homework and ask a professional money expert before you decide to buy any stocks with real money!)
Would you like me to explain any other complicated financial ideas in this simple, easy-to-read style?