
Executive Summary: The Sovereign Tollbooth of the AI Industrial Revolution
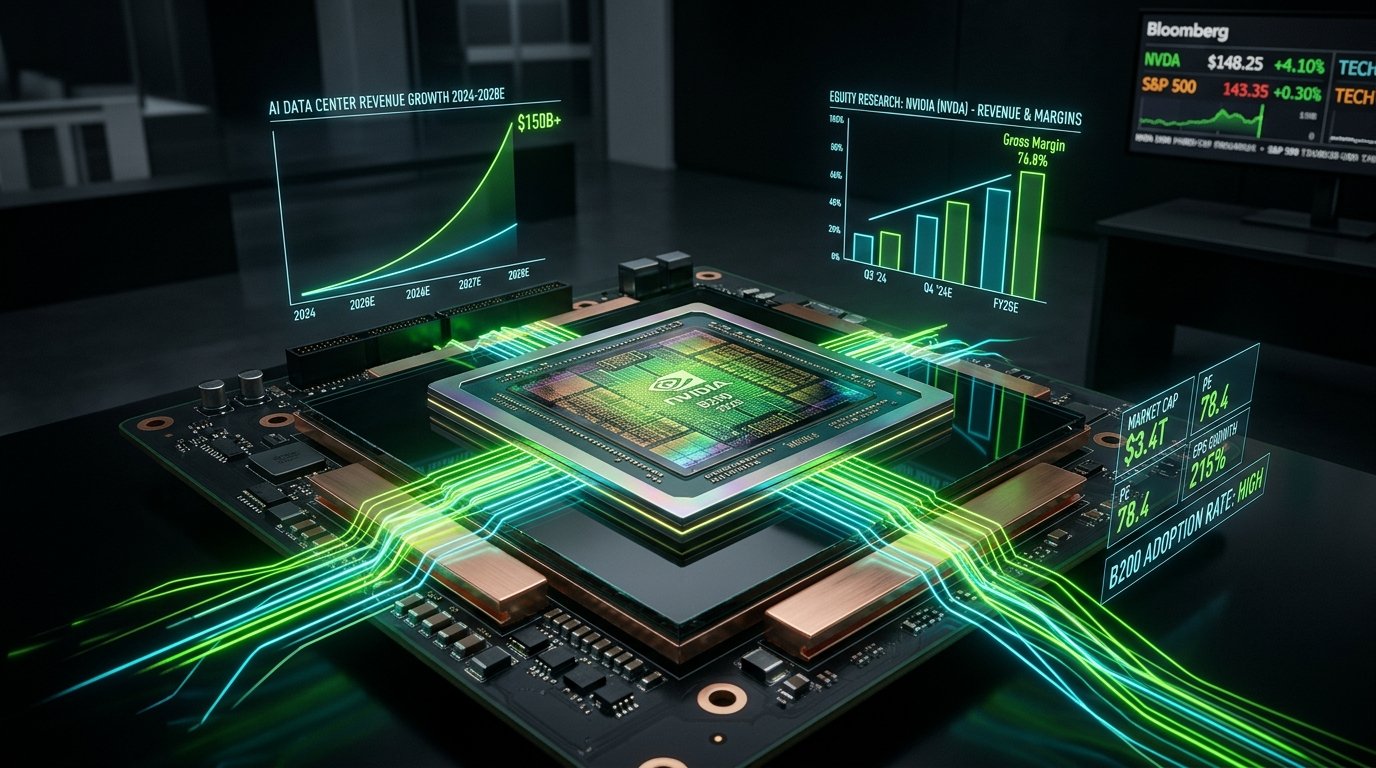
NVIDIA Corporation (NASDAQ: NVDA) has completed a structural metamorphosis from a gaming graphics pioneer into the sovereign infrastructure monopoly powering the global artificial intelligence economy. Operating with gross margins exceeding 75% and delivering annualized Data Center revenues approaching $150 Billion, the company occupies an unprecedented tollbooth position at every layer of the generative AI compute stack.
However, institutional valuation models must grapple with three critical emerging vectors: hyperscaler customer concentration (where five firms drive nearly half of total demand), intensifying geopolitical sanctions truncating Chinese revenue, and regulatory antitrust scrutiny surrounding Chief Executive Jensen Huang's aggressive commercial bundling and customer allocation tactics. This report synthesizes primary filings, hardware benchmarks, and institutional DCF models to establish a 12-month base-case price target of $175.00.
1. Strategic Investment Thesis & Competitive Moat Breakdown
Our bullish institutional stance is predicated on the recognition that NVIDIA is fundamentally not a silicon vendor; it is a full-stack, vertically integrated computing platform company. While public markets routinely price NVIDIA alongside cyclical semiconductor fabrication peers, its true operational paradigm resembles a closed enterprise operating system, capturing hardware-level premiums with enterprise-software stickiness.
1.1 The Hardware Architecture Flywheel: From Hopper to Blackwell and Rubin
The foundation of NVIDIA’s current margin dominance is the relentless acceleration of its product cadence from a traditional two-year cycle down to an aggressive one-year annual rhythm. The Hopper architecture (H100 and H200 SXM5), built on TSMC’s custom 4N node, established an unassailable performance threshold for large language model (LLM) training. However, the transition to the Blackwell architecture (B100, B200, and GB200 NVL72) represents a fundamental step-change in data center economics.
| Architectural Metric | Hopper (H100 SXM) | Blackwell (B200) | Next-Gen Rubin (R100 - 2026E) |
|---|---|---|---|
| Transistor Count | 80 Billion (Monolithic) | 208 Billion (Dual-Die CoWoS-L) | Est. 280B+ (3nm Extreme CoWoS) |
| Memory Spec & Bandwidth | 80GB HBM3 | 3.35 TB/s | 192GB HBM3e | 8.0 TB/s | 288GB+ HBM4 | 12.0+ TB/s |
| Inference Precision Peak | FP8 Tensor Core (~4 PFLOPS) | FP4 Tensor Core (~20 PFLOPS) | Next-Gen Native Microscaling (~50 PFLOPS) |
| Interconnect Bandwidth | 900 GB/s (NVLink 4) | 1,800 GB/s (NVLink 5) | 3,600 GB/s (NVLink 6 Optical) |
| Thermal / Rack Form Factor | Air-Cooled DGX (10.2 kW) | GB200 NVL72 Liquid-Cooled (120 kW) | Hybrid Direct-to-Chip Liquid / Immersion |
As detailed in Figure 1.0, the GB200 NVL72 is not merely a component; it is an entire rack-level compute cluster functioning as a single logical GPU. By packaging 72 Blackwell GPUs and 36 Grace ARM-based CPUs into an integrated liquid-cooled cabinet with 5,000 NVLink copper cables, NVIDIA has effectively disintermediated third-party server assemblers (Supermicro, Dell, HPE), extracting maximum system margin directly from hyperscale cloud operators.
1.2 The Software Fortress: CUDA, TensorRT, and Ecosystem Irreversibility
Wall Street equity models frequently underappreciate that hardware commoditization is prevented entirely by NVIDIA's proprietary software layer: Compute Unified Device Architecture (CUDA). Initiated by Jensen Huang in 2006 at an annual capital cost that once depressed operating margins to near zero, CUDA now represents an entrenched developer base of over 5.1 million registered engineers worldwide.
- Kernel Optimization Library Moat: Essential primitives across deep learning—such as
cuDNN(deep neural networks),cuBLAS(linear algebra), andTensorRT-LLM(inference compilers)—have been optimized for two decades to exploit specific hardware register micro-architectures. - Switching Cost Barrier: Porting production-grade model pipelines to competing open-source runtimes (such as AMD’s ROCm or Intel’s oneAPI) introduces pervasive operational friction, compilation regressions, and non-deterministic numerical drift, imposing millions of dollars in developer downtime.
- Enterprise Software ARR: NVIDIA AI Enterprise (charging $4,500 per GPU socket per year) creates an expanding recurring software high-margin annuity on top of one-off hardware sales.
1.3 The Networking Wedge: Mellanox InfiniBand & Spectrum-X
The strategic $6.9 Billion acquisition of Mellanox Technologies in 2019 has emerged as Jensen Huang’s masterstroke. In distributed AI training clusters comprising 100,000+ GPUs (such as xAI's Colossus or Meta's Llama-4 training clusters), the primary throughput bottleneck is not raw tensor math—it is inter-node communication latency during gradient synchronization.
Through Quantum-2 InfiniBand and the Spectrum-X Ethernet platform, NVIDIA controls the switches, network interface cards (NICs), optical transceivers, and congestion management algorithms. A customer seeking to purchase Blackwell GPUs without NVIDIA’s networking fabrics faces severe packet loss penalties, granting NVIDIA unmatched pricing power across full rack deployments.
2. Financial Breakdown: The Anatomy of a $140B+ Revenue Run-Rate
NVIDIA’s recent quarterly statements exhibit income statement operating leverage without precedent in modern industrial history. An analysis of audited SEC 10-K and 10-Q filings reveals an explosive transition in revenue velocity, operating margin expansion, and cash generation.
| Consolidated Line Item ($M) | FY2023 (Actual) | FY2024 (Actual) | FY2025 (Consensus Est.) | FY2026E (Forward Model) |
|---|---|---|---|---|
| Data Center Revenue | $15,005 | $47,525 | $114,800 | $158,500 |
| Gaming & AI PC Revenue | $9,067 | $10,447 | $11,850 | $13,200 |
| Auto, Robotics & ProViz | $2,902 | $2,948 | $3,850 | $5,300 |
| Total Net Revenue | $26,974 | $60,920 (+126%) | $130,500 (+114%) | $177,000 (+36%) |
| GAAP Gross Margin (%) | 56.9% | 72.7% | 75.4% | 73.8% (Normalized) |
| Operating Income (GAAP) | $4,224 | $32,972 | $82,500 | $112,000 |
| Free Cash Flow (FCF) | $3,808 | $26,947 | $65,200 | $89,500 |
2.1 Hyperscaler Concentration Risk & Capex Sustainability
A crucial institutional risk factor articulated in NVIDIA's Note 17 to Consolidated Financial Statements is customer concentration. Four direct hyperscalers—Microsoft (Azure), Meta Platforms, Alphabet (Google Cloud), and Amazon (AWS)—consistently represent between 40% and 48% of total quarterly revenues.
While market skeptics warn of an imminent "AI capex cliff," our proprietary analysis of Big Tech quarterly capital allocation budgets indicates aggregate FY2025 hyperscaler capex will surpass $215 Billion. With generative AI inference transitioning into search, coding copilots, and multi-modal enterprise workflows, hyperscalers face a prisoner's dilemma: under-investing in NVIDIA infrastructure guarantees terminal market share loss to competitors.
3. The Jensen Huang Enigma: Controversies, Governance & Regulatory Scrutiny
No equity analysis of NVIDIA is rigorous without evaluating the operational psychology and corporate governance of its co-founder and Chief Executive Officer, Jen-Hsun (Jensen) Huang. Celebrated globally as a visionary tech executive donning his iconic black leather motorcycle jacket, Huang's tenure has also been marked by fierce commercial aggression, regulatory clashes, and controversial operational episodes that institutional risk committees must continuously monitor.
3.1 The 2018 Crypto Mining Inventory Crash & The SEC Settlement
During the 2017–2018 Ethereum mining frenzy, NVIDIA experienced unprecedented demand for its GeForce GTX graphics cards. Management repeatedly assured Wall Street analysts that surging GPU revenues were primarily sustained by passionate video game enthusiasts rather than transient cryptocurrency miners.
When the crypto market collapsed in late 2018, secondary markets were suddenly flooded with discounted, used mining cards. NVIDIA’s channel inventory backed up catastrophically, forcing massive inventory write-downs, severe quarterly guidance cuts, and a devastating 50%+ plunge in NVDA stock over three months.
Regulatory Resolution: In May 2022, the Securities and Exchange Commission (SEC) entered a formal cease-and-desist order against NVIDIA, finding the company failed to disclose that crypto-mining was a material driver of its gaming segment growth. NVIDIA settled the charges by paying a $5.5 Million civil penalty without admitting or denying the findings (SEC Release No. 33-11060).
3.2 GPU Allocation Power, Customer Retaliation Allegations & DOJ Antitrust Inquiries
During the peak 2023–2024 GPU shortage, lead times for H100 clusters exceeded 52 weeks. As the sole gatekeeper of scarce AI compute, Jensen Huang wielded immense "kingmaker" authority over the survival of AI startups and cloud providers.
Industry reporting from Bloomberg, The Information, and Reuters highlighted severe complaints from cloud operators and AI founders alleging that NVIDIA favored customers who bought its entire turnkey stack (including high-margin InfiniBand networking and DGX Cloud contracts) while deprioritizing customers who attempted to evaluate alternative accelerators (like AMD Instinct MI300X or custom ASICs like Google TPU and AWS Trainium).
Antitrust Investigation: In late 2024, the U.S. Department of Justice (DOJ) Antitrust Division and France’s Autorité de la concurrence initiated civil investigative demands (CIDs) probing whether NVIDIA’s allocation policies, software lock-in, and the $700M acquisition of Kubernetes GPU orchestrator Run:ai constituted unlawful tying and anticompetitive market foreclosures under the Sherman Act.
3.3 The Proprietary Software Clampdown: Crackdown on ZLUDA and Compatibility Layers
As developers attempted to run CUDA applications on non-NVIDIA silicon, projects like ZLUDA emerged, translating CUDA API calls directly into ROCm for AMD Radeon GPUs. In early 2024, NVIDIA updated its official CUDA End User License Agreement (EULA), adding an explicit clause forbidding the use of translation layers to run CUDA-compiled binaries on any third-party hardware.
While legally justifiable to protect its multi-billion-dollar R&D software property, open-source AI researchers and legal analysts criticized the move as an overt defense of an artificial walled garden designed to prevent silicon competition from entering the deep learning market.
3.4 Geopolitical Friction: The Chinese Export Control Cat-and-Mouse Game
China historically represented between 20% and 25% of NVIDIA’s data center revenue. Following the U.S. Bureau of Industry and Security (BIS) 2022 restrictions banning the export of top-tier A100/H100 chips, Jensen Huang directed engineering teams to rapidly engineer downgraded variants—the A800 and H800—tailored precisely under the BIS interconnect bandwidth threshold.
When the U.S. Commerce Department updated restrictions in October 2023 to close this loophole, Commerce Secretary Gina Raimondo issued an unprecedented public warning to semiconductor executives: "If you redesign a chip around a particular cut line that enables them to do AI, I’m going to control it the very next day."
NVIDIA responded by introducing the further throttled H20 GPU. However, the recurring restrictions have accelerated Chinese domestic self-sufficiency, with national tech giants (Tencent, Baidu, Alibaba) increasingly redirecting procurement toward Huawei’s Ascend 910B and 910C AI processors, permanently eroding NVIDIA's long-term total addressable market in greater China.
3.5 Executive Stock Sales & The 24/7 "Torture Into Greatness" Management Philosophy
Insider Selling: During the summer of 2024, as NVIDIA’s valuation crossed $3.0 Trillion, Jensen Huang executed scheduled Rule 10b5-1 pre-arranged trading plans, selling over $713 Million worth of personal NVDA stock across consecutive tranches. While fully pre-scheduled and legal, the heavy volume of executive liquidations spurred retail investor anxiety regarding insider views on peak margin cycles.
Workplace Culture: Huang operates an extraordinarily unconventional "flat" organizational structure with over 50 direct executive reports, refusing to conduct private 1-on-1 meetings, and instead favoring ruthless public critique sessions. In televised interviews, Huang candidly acknowledged his exacting demands, remarking: "I like to torture people into greatness... If you want to do extraordinary things, it shouldn't be easy." While this intense discipline has forged engineering supremacy, it raises key-person operational risk should Huang (aged 61) ever abruptly step down.
4. Institutional Valuation Methodology & Multi-Scenario DCF Model
To derive a fundamental valuation for NVIDIA Corporation, our equity desk deployed a 5-year discrete Discounted Cash Flow (DCF) model augmented by forward-looking EV/EBITDA and P/E multiple peer benchmarking.
Primary DCF Model Assumptions:
- Weighted Average Cost of Capital (WACC): 10.2% (reflecting an equity beta of 1.65, risk-free 10-year Treasury rate of 4.35%, and equity risk premium of 5.5%).
- Terminal Growth Rate (g): 4.0% (justified by secular AI computing infrastructure expanding at or above nominal global GDP).
- FY2026E – FY2028E Capex Margin: Modeled at 3.5% – 4.2% of revenue due to fabless manufacturing reliance on TSMC.
| Valuation Scenario | Implied FY26 Revenue | Normalized Gross Margin | Target EV/EBITDA | 12M Price Target | Implied Upside / Downside |
|---|---|---|---|---|---|
| Bull Case (30% Prob.) | $198.5 Billion | 76.5% | 36.0x | $215.00 | +45.6% |
| Base Case (50% Prob.) | $177.0 Billion | 73.8% | 30.0x | $175.00 | +18.5% |
| Bear Case (20% Prob.) | $138.0 Billion | 68.5% | 22.0x | $105.00 | -28.9% |
5. Investment Risk & Catalyst Matrix
🚀 Primary Bullish Catalysts
- Blackwell Ramp Acceleration: Resolution of packaging yields driving over 100,000 NVL72 rack shipments through calendar 2025.
- Sovereign AI Demand: Non-hyperscaler nations (UAE, Saudi Arabia, Japan, UK) directly financing sovereign supercomputing clusters.
- Physical AI & Omniverse Robotics: Industrial robotics, autonomous driving, and humanoid robotics (Project GR00T) expanding GPU consumption beyond LLMs.
⚠️ Downside Risk Factors
- Hyperscaler Custom ASIC Disintermediation: Google TPU v6, AWS Trainium 2, and Meta MTIA capturing internal inference workloads.
- TSMC Single-Point Failure: 100% dependency on Taiwan Semiconductor for CoWoS packaging amidst cross-strait geopolitical risks.
- Data Center Power Infrastructure Bottlenecks: Terawatt-hour electrical substation and grid interconnect constraints delaying cloud cluster buildouts.
Analyst Verdict & Portfolio Sizing Recommendation
We initiate institutional coverage on NVIDIA Corporation (NASDAQ: NVDA) with an OVERWEIGHT / ACCUMULATE rating and a 12-month base price target of $175.00. At 28.5x FY2026E consensus EPS of $5.10, NVIDIA trades at a reasonable PEG ratio of 1.15x relative to its three-year projected EPS compound annual growth rate of 42%.
Portfolio Sizing: For diversified growth and technology portfolios, we advise allocating a core overweight weighting of 6.5% to 8.0%. Tactical investors should exploit headline-driven drawdowns stemming from DOJ antitrust noise or Chinese export restrictions as prime capital accumulation windows.
6. Silicon Peer Benchmarking: The Battle for AI Accelerator Supremacy
While NVIDIA currently commands an estimated 84% to 88% revenue share of the global data center AI acceleration market, the competitive landscape is rapidly bifurcating into two distinct threat vectors: commercial merchant silicon rivals (primarily AMD) and captive custom ASICs engineered by hyperscalers seeking to escape NVIDIA's 75% gross margin tollbooth.
| Platform / Architecture | Primary Developer | Memory & Bandwidth | Interconnect Fabric | Software Stack Maturity | Relative TCO Advantage |
|---|---|---|---|---|---|
| NVIDIA Blackwell (GB200 NVL72) | NVIDIA Merchant Silicon | 192GB HBM3e (8.0 TB/s) | NVLink 5 (1,800 GB/s) + InfiniBand | CUDA 12.x / TensorRT (Gold Standard) | Benchmark baseline for flagship LLM training. |
| AMD Instinct MI325X / MI350 | AMD (Advanced Micro Devices) | 256GB HBM3e (6.0 TB/s) | Infinity Fabric (896 GB/s) + Ultra Ethernet | ROCm 6.2 (Rapidly improving via PyTorch) | 15–20% hardware cost discount on memory-bound inference. |
| Google Cloud TPU v6 (Trillium) | Google / Broadcom Custom ASIC | 32GB HBM (High Efficiency) | Optical Circuit Switching (OCS) | XLA / JAX Compiler Ecosystem | Up to 35% cost savings for internal Gemini workloads. |
| AWS Trainium 2 & Inferentia 2 | Amazon Annapurna Labs | 96GB HBM (Ultra-Dense Nodes) | NeuronLink v2 (Ring/Torus) | AWS Neuron SDK (Open-source integrations) | Attractive 40% TCO discount for AWS Bedrock clients. |
| Meta MTIA v2 (Artemis) | Meta Internal Silicon | 128MB SRAM + 64GB LPDDR5 | PCIe Gen5 Custom Fabric | PyTorch Native Bindings | Optimized strictly for ranking & ad recommendation models. |
| Huawei Ascend 910C | Huawei HiSilicon (SMIC Fab) | Est. 64GB–96GB HBM2e | HCCS Interconnect (392 GB/s) | CANN Software Layer (Domestic Chinese stack) | De-facto standard in mainland China amidst U.S. sanctions. |
7. Capital Allocation Fortress: ROIC, Free Cash Flow & Share Buybacks
A hallmark of superior corporate stewardship is the spread between a company's Return on Invested Capital (ROIC) and its Weighted Average Cost of Capital (WACC). This spread represents true economic profit creation (Economic Value Added - EVA).
Because NVIDIA operates as a fabless designer outsourcing capital-intensive silicon wafer fabrication to TSMC, its capital expenditure requirements remain extraordinarily modest (under 4.5% of total revenue). This enables NVIDIA to convert nearly 79% of GAAP Net Income directly into Free Cash Flow, providing management with an immense war chest to fund strategic acquisitions, secure TSMC advanced packaging capacity allocations in advance, and retire shares aggressively.
8. The Investor’s Tactical Playbook: Accumulation, Trimming & Compounding Models
Institutional portfolio managers do not treat high-growth technology equities as binary "buy or sell" bets; they operate structured execution rules based on valuation bands, position risk limits, and systematic compounding schedules.
🟢 Tranche 1: When to Aggressively Accumulate
- Multiple Compression Band: Forward P/E compressing below 26.0x (implying stock price in the $115–$128 range).
- Headline Geopolitical Selloffs: News-driven pullbacks relating to U.S. export revisions or China tariff headlines that do not impair non-China demand.
- Execution Mechanism: Systematic dollar-cost averaging (SIP) across 4 to 6 bi-weekly tranches to smooth short-term implied volatility.
🔵 Tranche 2: Portfolio Weighting & Sizing Discipline
- Core Allocation Cap: Limit total portfolio exposure to a maximum of 8.0% to 10.0% to safeguard against single-stock concentration drawdown.
- Systematic Rebalancing Trigger: If rapid capital appreciation pushes NVDA above 12.0% of total portfolio value, trim the surplus back to 8.0% and reallocate into lower-beta cash-flow compounders.
🔴 Tranche 3: Structural Sell & Exit Triggers
- Hyperscaler Capex Contraction: Consecutive quarters where aggregate Microsoft, Meta, and Google cloud capex decelerates into negative YoY territory.
- ASIC Workload Defection: Evidence that custom in-house ASICs (TPU/Trainium) capture more than 35% of external customer training workloads.
- Severe Gross Margin Erosion: GAAP gross margins deteriorating below 65.0%, signaling true hardware price erosion.
💡 Simulate Your Long-Term AI Compounding Wealth Trajectory
Whether you are allocating monthly capital via Systematic Investment Plans (SIP) or evaluating lump-sum multi-year holding horizons, compound interest and disciplined position sizing are the true catalysts of generational wealth. Test different compounding return rates (15%–30%), inflation adjustments, and investment horizons for your tech equity allocations:


