
What is Technical Analysis?
The evaluation of securities through technical analysis, Analysts uses historical price and volume statistics to generate statistical market trends. Technical analysis operates differently from fundamental analysis since its focus lies in market psychology combined with price studies for predicting market responses.
Key Uses:
Short-term trading (days/weeks).
Timing entry/exit points.
Identifying trends and reversals.
Core Concepts
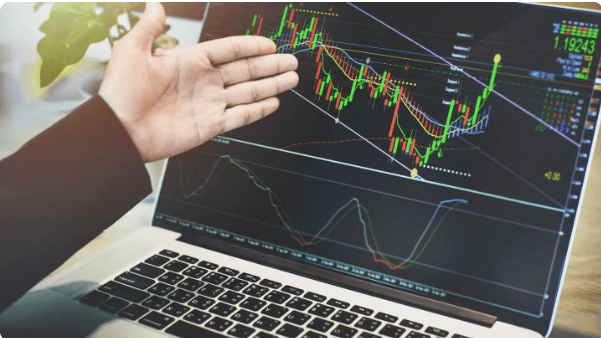
1. Price Charts
Visual representations of price movements over time:
The closing price trends for the Nifty 50 appear in simple line charts through a one-year period.
Candlestick Charts: Details open, high, low, close (e.g., Reliance’s daily volatility).
Bar Charts serve as an alternative visual tool to candlesticks with slightly reduced appearance.
2. Trends
Uptrend: Higher highs and higher lows (e.g., Infosys in 2021).
Downtrend: Lower highs and lower lows (e.g., Zomato post-IPO).
The prices of ITC remained within a specific range during 2023.
Visual identification occurs through drawing connecting lines between peaks (resistance) and troughs (support).
3. Support & Resistance
The point of maximum purchase activity occurs at ₹1,400 for the HDFC Bank stock.
Resistance manifests when sellers intensify their pressure at the price level of ₹600 concerning Tata Motors.
Price movements that exceed resistance trigger a possible uptrend indication.
4. Volume
High Volume + Price Rise: Confirms bullish sentiment (e.g., Adani Enterprises during a rally).
Market panic arises when selling volume increases simultaneously with price reduction (such as during the Yes Bank collapse).
5. Technical Indicators
Example: Reliance Industries in 2023:
The RSI indicator reached 80 causing an overbought situation thus leading to a brief market correction.
The 50-day MA functioned as a moving support mechanism during ascent in prices.
Tasks for you 😊👍
1. Chart Analysis Practice:
Examine HDFC Bank’s 6-month candlestick chart by accessing it through TradingView or Zerodha.
Identify:
Current trend (uptrend/downtrend/sideways).
Key support/resistance levels.
2. Apply Indicators:
RSI and 50-day MA should be added to analyze the TCS price chart. Note if RSI signals overbought/oversold.
3. Paper Trade:
Evaluate a moving average crossover strategy by implementing it through Zerodha’s Streak virtual account platform.
Key Takeaways
Profiting demands the usage of multiple tools which can involve RSI combined with MACD as confirmation indicators.
The strength of market movements depends on checking trends with volume figures.
Higher timeframes such as daily and weekly should be preferred since they provide fewer noisy price fluctuations with fewer confusion and uncertainty.
Common Mistakes
An overload of five or more indicators simultaneously leads to indicator confusion.
Technical analysts should merge fundamental data with their indicators to maintain effective long-term asset ownership.
Social media “hot picks” should be ignored whenever possible along with blind chasing of tips.
FAQs for Indian Traders
Best free charting tools in India?
TradingView (free tier), Investing.com, or broker platforms like Zerodha Kite ,Motilal Oswal
Can technical analysis predict earnings?
Price action monitoring continues throughout the market without connection to corporate announcements.
How to handle market manipulation?
Large-cap stocks should be the focus because manipulation tends to affect small-caps more than it does large-cap stocks.
Can you be more specific about the content of your article? After reading it, I still have some doubts. Hope you can help me.