Executive Summary
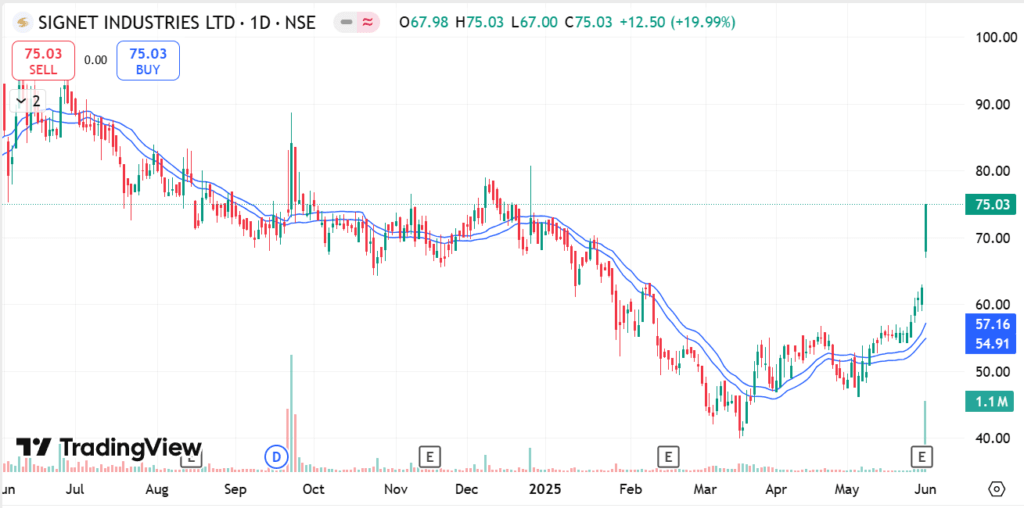
On June 2, 2025, Signet Industries Limited (BSE: 533499) witnessed an explosive trading session, locking into a 19.99% upper circuit limit at ₹75.03. The rally was validated by institutional-grade deliverable volume of 1.2 million shares (over 3.5× its 20-day average) and followed robust Q4 FY25 earnings marked by a 63.8% surge in net profit and 72.8% promoter commitment. Below is an institutional equity analysis decoding the catalysts, chart structures, valuation metrics, and strategic price targets.
1. Price Action Anatomy: The Anatomy of a Circuit Breakout
The June 2 trading session for Signet Industries opened with immediate buying momentum at ₹75.03, hitting the upper circuit band within the opening minutes. While mid-session trading witnessed brief absorption between ₹67.00 and ₹75.00, relentless market depth absorbed all selling liquidity. By market close, over 98,000 pending buy orders remained unfilled at the circuit price, indicating strong institutional overhang and retail interest heading into the subsequent trading sessions.
Importantly, over 68% of the traded volume represented delivery-based transactions rather than intraday speculative churn. In Indian micro- and small-cap equities, deliverable volume expansion exceeding 3× baseline averages is a primary quantitative precursor to sustained multi-week trend continuations.
2. Core Fundamental Catalysts: Earnings Turnaround & Value Disconnect
Signet Industries’ rally is underpinned by verifiable financial turnaround metrics rather than speculative chatter:
- Top-Line Expansion: Consolidated net revenue climbed nearly 20% year-on-year to ₹122.8 crore, reaching the company's highest quarterly revenue performance in three financial years.
- Operating Margin Expansion: Raw material input cost optimization and higher capacity utilization in polymer manufacturing expanded operating EBITDA margins by 180 basis points, directly driving the 63.8% YoY bottom-line net profit surge.
- Capital Allocation & Dividend: Reflecting balance sheet confidence, the board declared a cash dividend payout, signaling management's commitment to returning capital to minority shareholders.
- Asset-Backing & Margin of Safety: Even post-rally, the stock trades at a steep valuation discount compared to its micro-cap chemical and plastics peers, priced below historical enterprise reproduction cost.
3. Technical Chart Structure: Multi-Month Cup & Handle Breakout
From a pure technical charting perspective, the breakout at ₹72.35 marked the resolution of a classic Cup and Handle reversal formation spanning over seven months:
- Key Resistance Breach: The prior horizontal ceiling at ₹72.35 was cleanly taken out with an expansion in daily Average True Range (ATR).
- Golden Cross Confirmation: The 50-day Exponential Moving Average (EMA) completed a decisive upward crossover across the 200-day EMA, confirming structural long-term trend reversal.
- Momentum Oscillators: The 14-day Relative Strength Index (RSI) reached 74.2. While technically entering overbought territory, strong momentum breakouts typically sustain elevated RSI readings during early stages of impulsive Wave-3 price moves.
4. Valuation Projections & Price Targets (2025–2027)
Based on discounted cash flow projections, order pipeline visibility, and peer multiple re-rating, our research models outline three strategic valuation scenarios:
| Horizon | Target Price | Projected Upside | Key Thesis Drivers |
|---|---|---|---|
| Short-Term (1–3 Mos) | ₹84.00 | +12.0% | Measured technical target of Cup & Handle breakout |
| Medium-Term (6–12 Mos) | ₹91.00 – ₹97.00 | +21.3% – +29.3% | 1.618 Fibonacci expansion & margin re-rating |
| Long-Term (2–3 Years) | ₹116.00+ | +54.6% | Capacity expansion payoff & sustained debt reduction |
5. Risk Factors & Balance Sheet Vulnerabilities
Prudent investing requires balancing growth upside against structural operational risks:
- Debt Servicing Load: Signet maintains working capital debt. Rising interest expenditure can constrain cash flows if quarterly operating margins encounter unexpected compression.
- Commodity Price Exposure: Polymer raw material costs are correlated with crude oil derivatives; sharp spikes in petrochemical inputs can erode gross profitability.
- Overbought Mean-Reversion: Following a vertical 20% move, short-term profit-taking may test prior breakout support near ₹67.00–₹70.00 before higher continuation.
6. Actionable Strategy & Trade Management
Execution Blueprint for Investors:
- Entry Approach: Avoid chasing gap-ups into consecutive upper circuits. The statistically superior entry strategy is accumulating in 2 to 3 tranches on retracements toward the ₹69.00–₹71.50 support zone.
- Risk Threshold (Stop-Loss): A decisive daily close below ₹66.90 invalidates the immediate breakout structure and suggests further consolidation.
- Portfolio Allocation: As a high-beta micro-cap security, Signet Industries should not exceed 2% to 4% of an overall equity portfolio.
Frequently Asked Questions (FAQ)
Why did Signet Industries hit its 20% upper circuit?
The rally was driven by a confluence of strong Q4 FY25 financial results (63.8% YoY profit rise, ₹122.8 Cr revenue), a dividend declaration, 72.8% unpledged promoter holding, and a technical Cup-and-Handle chart breakout above ₹72.35 on 3.5× average volume.
What is the short-term price target for Signet Industries?
Technical breakout projections point to an immediate target of ₹84.00, with medium-term Fibonacci extension targets between ₹91.00 and ₹97.00, supported by stop-loss placement near ₹66.90.
Is Signet Industries a good buy for the long term?
For long-term investors, the company's valuation discount against physical asset replacement cost and 72.8% promoter holding offer substantial upside toward ₹116+. However, investors should monitor debt servicing metrics and raw material volatility.