Executive Summary
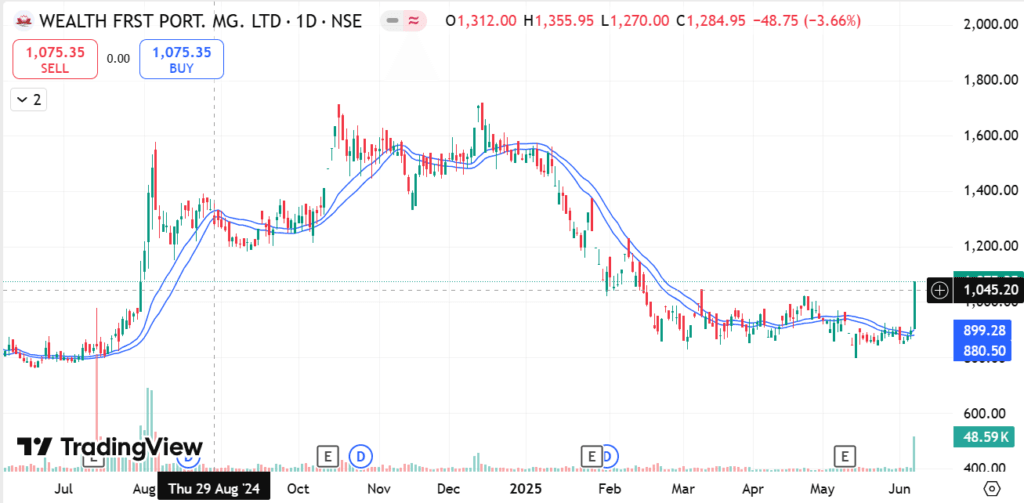
On June 6, 2025, Wealth First Portfolio Managers Ltd (NSE: WEALTH) locked into a 20.00% upper circuit at ₹1,075.35 on unprecedented institutional volume (7× its 30-day average). The vertical breakout reflects rapid expansion in high-net-worth individual (HNI) asset management, capital-light advisory margins exceeding 45%, and the compounding financialization of Indian domestic household savings.
1. Core Investment Thesis: The Financialization of Indian Savings
Wealth First operates as a boutique wealth management firm catering to affluent retail, HNI, and corporate treasuries. Unlike traditional cyclical brokerages dependent on market turnover, Wealth First generates recurring trail commission fees and performance-linked management fees from its expanding Assets Under Management (AUM).
With Indian monthly mutual fund SIP inflows consistently surpassing ₹20,000 crore and direct equity market participation deepening across Tier-2 and Tier-3 business communities, wealth management firms are undergoing a structural multi-year valuation re-rating.
2. Technical Blueprint: Uncharted Blue-Sky Territory
The breakout at ₹1,000 psychological resistance launched the stock into price discovery with zero overhead supply:
- Psychological Milestone: Reclaiming and closing above the 4-digit ₹1,000 threshold triggered algorithmic institutional buy orders.
- Delivery Concentration: Traded delivery exceeded 74%, indicating long-term institutional accumulation rather than transient speculative churning.
- Bollinger Band Expansion: Volatility bands expanded aggressively on the weekly timeframe, confirming the onset of a new cyclical markup phase.
3. Strategic Targets & Valuation Matrix
| Target Stage | Price Objective | Implied Upside | Rationale |
|---|---|---|---|
| Stage 1 (Immediate) | ₹1,180.00 | +9.7% | Initial momentum continuation of 4-digit breakout |
| Stage 2 (6–12 Mos) | ₹1,350.00 – ₹1,420.00 | +25.5% – +32.0% | P/E expansion towards peer medians (Prudent Corporate, Anand Rathi) |
| Stage 3 (2–3 Years) | ₹1,750.00+ | +62.7% | 25%+ AUM CAGR and high dividend distribution yield |
4. Key Risks to Monitor
- Broad Market Correction Risk: A sharp, sustained correction in the Nifty 50 or broader market indices can temporarily decelerate fresh equity inflows and dampen PMS performance fee yields.
- Regulatory Pressures: Ongoing SEBI review of total expense ratios (TER) and mutual fund commission structures could exert moderate fee pressure over the long term.
5. Investment Conclusion & Risk Parameters
Recommendation: BUY ON PULLBACKS
- Favorable Entry Range: ₹1,010.00 – ₹1,040.00
- Support / Stop-Loss: ₹965.00 (Closing basis)
- Target 1: ₹1,180.00 | Target 2: ₹1,350.00